Page 39 - Layout 1
P. 39
6 Injury
Bulk carriers
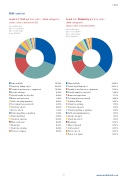
Graph 6.7: Cost per loss code – claim categoriesGraph 6.8: Frequency per loss code –
Claims 5,000–3,000,000 (USD)claim categories
Period: 2005-2014 Claims 5,000–3,000,000 (USD)
Type of vessel: Bulker Period: 2005-2014
Type of claim: Injury Type of vessel: Bulker
As per 7/10/2015
Type of claim: Injury
As per 7/10/2015
Slips and fallsSlips and falls30.78% 38.07%
Struck by falling objectStruck by falling object29.81% 22.73%
Caught in machinery or equipmentCaught in machinery or equipment14.82%11.36%
Suicide attemptStruck/caught by object(s)4.42% 5.68%
Struck/caught by object(s)Burns and explosions4.09% 5.11%
Burns and explosionsTool injury (non-powered)3.26%2.84%
Suffocation/asphyxiation 2.86%Strain by lifting2.27%
Tool injury (non-powered) Strain by carrying1.70% 2.30%
Struck by vehicleChemical exposure1.70% 2.00%
Electric shockStrain by pulling or pushing1.70%1.23%
Strain by pulling or pushing Suffocation/asphyxiation 1.70% 1.04%
Strain by liftingSuicide attempt 1.14% 0.96%
Chemical exposureStruck by vehicle 1.14% 0.88%
Man overboardDrowning 0.57%0.62%
Drowning 0.43% Man overboard 0.57%
Strain by carrying 0.42% Cut by object 0.57%
Power tool injury 0.07%Electric shock 0.57%
Power tool injury0.57%
37www.swedishclub.com