Page 37 - Layout 1
P. 37
6 Injury
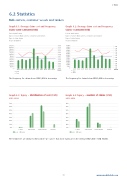
6.2 Statistics
Bulk carriers, container vessels and tankers
Graph 6.1: Average claim cost and frequencyGraph 6.2: Average claim cost and frequency
Claims 5,000–3,000,000 (USD)Claims 1-3,000,000 (USD)
Period: 2005-2014Period: 2005-2014
Types of vessel: Bulk carriers, containers and tankers Types of vessel: Bulk carriers, containers and tankers
Type of claim: InjuryType of claim: Injury
As per 5/10/2015As per 5/10/2015
130,000 0.13 70,000
120,000 0.12 65,0000.20
110,000 0.11 60,000 0.18
100,0000.10 55,000 0.16
90,000 0.09 50,000 0.14
80,000 0.08 45,000
70,000 0.07 40,000 0.12
60,000 0.06 35,000 0.10 30,000
50,000 0.05 25,0000.08
40,000 0.04 20,000 0.06
30,000 0.03 15,000 0.04
20,000 0.02 10,000
10,0000.01 0.025,000
00.00 0 2005 2006 2007 2008 2009 2010 2011 2012 2013 2014 0.00
PERIODCost 2005 2006 2007 2008 2009 2010 2011 2012 2013 2014PERIOD
FreqCost
Freq
The frequency for claims above USD 5,000 is increasing.The frequency for claims below USD 5,000 is decreasing.
Graph 6.3: Injury – distribution of cost (USD) Graph 6.4: Injury – number of claims (USD)
2013-20142013-2014
70% 70%
60% 60%
50% 50%
40% 40%
30% 30%
20% 20%
10%10%
0%0%
1-5,0001-5,000 5,000-50,00050,000-500,000500,000+5,000-50,00050,000-500,000500,000+
2013 20142013 2014
The trends here are similar to illness where we can see that most claims are in the interval USD 5,000 – USD 50,000.
35 www.swedishclub.com