Page 38 - Layout 1
P. 38
6 Injury
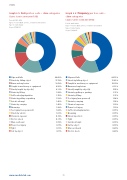
Graph 6.5: Cost per loss code – claim categoriesGraph 6.6: Frequency per loss code –
Claims 5,000–3,000,000 (USD)claim categories
Period: 2005-2014Claims 5,000–3,000,000 (USD)
Types of vessel: Bulk carriers, containers and tankers
Period: 2005-2014
Type of claim: InjuryTypes of vessel: Bulk carriers, containers and tankers
As per 7/10/2015Type of claim: Injury
As per 7/10/2015
Slips and fallsSlips and falls44.60% 44.55%
Struck by falling objectStruck by falling object17.79% 15.45%
Burns and explosionsCaught in machinery or equipment12.12%10.30%
Caught in machinery or equipmentBurns and explosions8.50% 6.53%
Struck/caught by object(s)Struck/caught by object(s)4.33% 5.74%
Strain by liftingStrain by pulling or pushing1.89%3.17%
Suffocation/asphyxiation 1.70%Strain by lifting3.17%
Tool injury (non-powered)1.98% Strain by pulling or pushing1.58%
Strain by carrying1.78% Suicide attempt1.46%
Chemical exposure1.39% Strain by carrying1.40%
Power tool injury1.19%Drowning 1.22%
Suffocation/asphyxiation 0.79% Tool injury (non-powered) 1.04%
Drowning 0.79% Struck by vehicle 1.03%
Struck by vehicle 0.79% Chemical exposure 0.39%
Fight 0.79%Electric shock0.37%
Man overboard0.19% Suicide attempt 0.59%
Power tool injury0.17%Cut by object 0.59%
Fight 0.13%Man overboard0.20%
Cut by object 0.11% Electric shock0.20%
www.swedishclub.com 36