Page 40 - Layout 1
P. 40
6 Injury
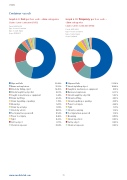
Container vessels
Graph 6.9: Cost per loss code –claim categoriesGraph 6.10: Frequency per loss code –
Claims 5,000–3,000,000 (USD)claim categories
Period: 2005-2014Claims 5,000–3,000,000 (USD)
Type of vessel: Container Period: 2005-2014
Type of claim: InjuryType of vessel: Container
As per 7/10/2015
Type of claim: Injury
As per 7/10/2015
Slips and fallsSlips and falls53.48% 51.58%
Burns and explosionsStruck by falling object17.81% 10.86%
Struck by falling objectCaught in machinery or equipment12.25% 8.14%
Struck/caught by object(s)Burns and explosions4.83% 6.33%
Caught in machinery or equipmentStruck/caught by object(s)3.24% 5.43%
Strain by liftingStrain by lifting2.54% 4.45%
Strain by pulling or pushingStrain by pulling or pushing1.78%4.07%
Drowning 1.20%Power tool injury2.26%
Fight 1.81% Strain by carrying1.09%
Strain by carrying 1.36% Struck by vehicle0.65%
Tool injury (non-powered) 1.36% Tool injury (non-powered)0.52%
Drowning 0.90%Power tool injury0.26%
Fight 0.23%Struck by vehicle 0.45%
Cut by object 0.11% Cut by object 0.45%
Chemical exposure0.04%Chemical exposure0.45%
www.swedishclub.com38