Page 41 - Layout 1
P. 41
6 Injury
Tankers
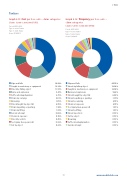
Graph 6.11: Cost per loss code – claim categoriesGraph 6.12: Frequency per loss code –
Claims 5,000–3,000,000 (USD)claim categories
Period: 2005-2014 Claims 5,000–3,000,000 (USD)
Type of vessel: Tanker Period: 2005-2014
Type of claim: Injury Type of vessel: Tanker
As per 7/10/2015
Type of claim: Injury
As per 7/10/2015
Slips and fallsSlips and falls38.82% 40.74%
Caught in machinery or equipmentStruck by falling object16.14% 12.96%
Struck by falling objectCaught in machinery or equipment13.91%12.96%
Burns and explosionsBurns and explosions8.41%9.26%
Suffocation/asphyxiation 6.15% Struck/caught by object(s)6.48%
Strain by carrying 4.83% Strain by pulling or pushing3.70%
Drowning 3.05%Strain by carrying2.78%
Chemical exposureStruck/caught by object(s) 2.85% 2.78%
Tool injury (non-powered)Strain by pulling or pushing 1.92% 1.85%
Strain by liftingStrain by lifting1.30% 1.85%
Struck by vehicleSuicide attempt0.86% 0.93%
Cut by objectChemical exposure0.76% 0.93%
Drowning 0.93% Struck by vehicle0.45%
Suffocation/asphyxiation 0.93% Tool injury (non-powered) 0.36%
Suicide attempt 0.93%Cut by object0.23%
39www.swedishclub.com