Page 9 - Layout 1
P. 9
4 General statistics
Graph 4.3 shows the cost per insured vessel by vessel type. The frequency and cost for tankers is the lowest of the three types
of vessel, however, the frequency and cost for containers is rising. For bulk carriers the frequency has been rising since 2009.
It should be understood that due to time lag in recording the claims costs for 2014 the picture may be different in time. This
is unavoidable with statistics of this nature.
Graph 4.4 shows the frequency and cost for the three claim categories. For all three categories the frequency has increased
signiicantly over the last couple of years. This is a worrying trend which we are monitoring.
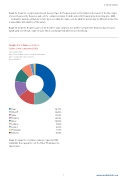
Graph 4.5: Claims cost in %
Claims 5,000–3,000,000 (USD)
Period: 2005-2014
Types of vessel: Bulk carriers, containers and tankers
Types of claims: All claim categories
As per 25/9/2015
Cargo 36.73%
Other PI 14.20%
Injury 13.62%
Pollution 12.54%
Illness 10.88%
Collision 7.80%
Contact 2.61%
Stowaways 1.57%
Advisory0.04%
Graph 4.5 shows the cost when claims are capped at USD
3,000,000. If uncapped the cost for ‘Other PI’ will have the
largest share.
7 www.swedishclub.com