Page 8 - Layout 1
P. 8
4 General statistics
4 General statistics
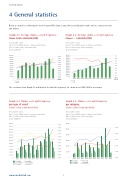
Below are statistics combining the most frequent P&I claims, (cargo, illness and injury) on bulk carriers, container vessels
and tankers.
Graph 4.1: Average claims costs & frequency Graph 4.2: Average claims costs & frequency
Claims 5,000–3,000,000 (USD)Claims 1 – 3,000,000 (USD)
Period: 2005 - 2014Period: 2005 - 2014
Types of vessel: Bulk carriers, containers and tankers Types of vessel: Bulk carriers, containers and tankers
Type of claims: Cargo, illness and injuryType of claims: Cargo, illness and injury
As per 25/9/2015As per 25/9/2015
110,000 70,0000.55 0.9
100,000 65,00060,000 0.8
90,000 55,000 0.50
80,000 0.7 50,0000.45
70,000 45,000 0.6 0.40
60,000 40,000 0.5 0.35
35,000 0.30
50,000 30,000 0.4 0.25
40,000 25,000 0.3 0.20
30,000 20,00015,000 0.2 0.15
20,000 10,000 0.10
10,000 0.10.05 5,000
00.00 00.00
2005 2006 2007 2008 2009 2010 2011 2012 2013 2014PERIOD2005 2006 2007 2008 2009 2010 2011 2012 2013 2014 PERIOD
Cost Cost
FreqFreq
The conclusion from Graph 4.1 and Graph 4.2 is that the frequency for claims above USD 5,000 is increasing.
Graph 4.3: Claims costs and frequency Graph 4.4: Claims costs and frequency
per type of vesselper category
Claims 5,000–3,000,000 (USD)Claims 5,000–3,000,000 (USD)
Period: 2005 - 2014Period: 2005 - 2014
Types of vessel: Bulk carriers, containers and tankers Types of vessel: Bulk carriers, containers and tankers
Type of claims: Cargo, illness and injuryType of claims: Cargo, illness and injury
As per 25/9/2015As per 25/9/2015
24,000 0.022 30,000
22,000
0.020 0.25
20,000 25,000
18,000 0.018
0.016 0.20
16,000 20,000
0.014
14,000 0.15
12,000 0.012 15,000
0.010
10,000
8,000 0.008 10,0000.10
6,000 0.006
4,000 0.004 5,000 0.05
2,0000.002
0.00
0 2005 2006 2007 2008 2009 2010 2011 2012 2013 20140.00002005 2006 2007 2008 2009 2010 2011 2012 2013 2014
Cost cargo Freq cargo
Cost bulker Cost container Freq bulker Freq container Cost injury Freq injury
Cost tankerFreq tankerCost illnessFreq illness
www.swedishclub.com6