Page 11 - Layout 1
P. 11
5 Cargo
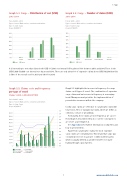
Graph 5.3: Cargo – Distribution of cost (USD) Graph 5.4: Cargo – Number of claims (USD)
2013-20142013-2014
Period: 2005 - 2014Period: 2005 - 2014
Types of vessel: Bulk carriers, containers and tankers Types of vessel: Bulk carriers, containers and tankers
Type of claim: CargoType of claim: Cargo
As per 25/9/2015As per 25/9/2015
60%70%
60%
50%
50%
40%
40%
30%
30%
20%
20%
10%10%
0%0%
1-5,000 5,000-50,00050,000-500,000500,000+1-5,000 5,000-50,000 50,000-500,000500,000+
201320142013 2014
It is interesting to note that claims in the USD 1-5,000 cost interval fell by almost 50% between 2013 and 2014. Those in the
USD 5,000-50,000 cost interval rose by around 30%. There are only about 1% of expensive claims above USD 500,000 but this
is 50% of the overall cost for 2013 and 30% for 2014.
Graph 5.5: Claims costs and frequency Graph 5.5 highlights the increase in frequency for cargo
per type of vesselclaims on all types of vessel. The combination of expensive
Claims 5,000–3,000,000 (USD)cargo claims and an increase in frequency is a worrying
trend. Managers must prioritise the implementation of
Period: 2005 - 2014preventative measures within the company.
Types of vessel: Bulk carriers, containers and tankers
Type of claim: Cargo
As per 25/9/2015Costly cargo claims are often due to catastrophic claims like
total losses, ires or navigational claims, which we deine as
collisions, contact or groundings.0,12
20,0000,11
Fortunately, these claims are not frequent as we can see
18,0000,10
16,000 0,09from Graph 5.7, but when they do occur the consequences
are severe as per Graph 5.6.
14,000 0,08
See Appendix (i) for further information on ship ires and
12,000 0,07
how to prevent them.0,06
Apart from catastrophic claims, the most expensive 10,000
0,05
cargo claims are contamination. This means that cargo was 8,000
0,04
contaminated or not in a proper condition when loaded, 6,000 0,03
which is usually deined as an inherent defect or water
4,000 0,02
leaking through cargo hatches.2,000
0,01
0 0,00
2005 2006 2007 2008 2009 2010 2011 2012 2013 2014
Cost bulker Freq bulker
Cost container Freq container
Cost tankerFreq tanker
9www.swedishclub.com