Page 13 - Layout 1
P. 13
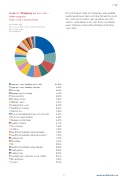
5 Cargo


Graph 5.7: Frequency per loss code – The most frequent claims are for improper cargo handling,

claim categoriesusually caused by procedures not being followed. To prevent
this, crews need to monitor cargo operations and collect
Claims 5,000–3,000,000 (USD)
evidence of any damage to the cargo that occurs. Having
Period: 2005-2014
proper testing procedures will most likely prevent future
Types of vessel: Bulk carriers, containers and tankers cargo claims.
Type of claim: Cargo
As per 29/9/2015


Improper cargo handling, shore-side 21.40%

Improper cargo handling, shipside 9.47%

Poor tally8.23%
Damage prior to loading6.17%

Heavy weather 6.04%

Flooding of hold 5.90%
Multiple causes 5.35%

Leaking hatch covers 4.39%

Insuficient cleaning 4.25%
Inherent vice3.29%

Poor monitoring/maintenance of reefer unit 2.61%

Reefer mechanical failure2.61%
Damage post discharge2.61%

Leaking container2.33%

Poor stowage1.92%
Collision1.92%

Insuficient lashing/securing by shipper 1.92%

Insuficient lashing/securing by stevedore 1.78%
Leaking vents1.78%

Grounding1.65%

Fire0.82%
Insuficient lashing/securing, shipside 0.82%

Leaking pipes0.82%

Leaking cargo0.69%
Loading heavy containers on top of light 0.55%

Blocked bilges0.41%

Contact0.27%


11www.swedishclub.com