Page 15 - Layout 1
P. 15
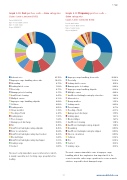
5 Cargo


Graph 5.10: Cost per loss code – claim categoriesGraph 5.11: Frequency per loss code –

Claims 5,000–3,000,000 (USD)claim categories

Period: 2005-2014Claims 5,000–3,000,000 (USD)
Type of vessel: Bulk carriers
Period: 2005-2014
Type of claim: CargoType of vessel: Bulk carriers
As per 30/9/2015Type of claim: Cargo

As per 30/9/2015


25.70% Inherent viceImproper cargo handling, shore-side 25.68%
10.87%Improper cargo handling, shore-sidePoor tally13.38%

Grounding 8.77%Leaking hatch covers9.76%

Damage prior to loading8.68% Leaking hatch covers7.62%
8.32% Poor tally6.77% Improper cargo handling, shipside

4.88% Damage prior to loading6.17% Multiple causes

3.62% Insuficient cleaning4.47% Insuficient lashing/securing by stevedore
3.25% Multiple causes4.33% Inherent vice

3.07% Improper cargo handling, shipside4.08%Heavy weather

2.89% Collision 4.08%Leaking vents
2.71% Leaking ventsPoor stowage4.05%

2.35% Heavy weatherFlooding of hold 3.72%

1.99% Flooding of holdDamage post discharge 2.41%
1.63% Leaking pipesLeaking pipes1.93%

1.27% Poor stowage1.44% Blocked bilges

1.08% Damage post discharge0.90%Insuficient cleaning
1.08% Fire 0.70%Insuficient lashing/securing, shipside

Grounding 0.90% Insuficient lashing/securing, shipside 0.45%

Insuficient lashing/securing by shipper 0.90% Error in calculation0.44%
Error in calculation 0.90% Insuficient lashing/securing by stevedore 0.43%

Collision 0.72% Blocked bilges0.41%

Fire 0.54% Insuficient lashing/securing by shipper0.13%
Contact 0.18% Leaking cargo0.10%

Leaking cargo 0.18%Contact 0.01%


The most common immediate cause is improper cargo
The most costly immediate cause is inherent vice which
handling, which also emphasises how important it is for is mainly caused by not checking cargo properly before

crews to monitor entire cargo operations to secure as much loading.
evidence as possible about damaged cargo.


13www.swedishclub.com