Page 48 - Layout 1
P. 48
7 Illness
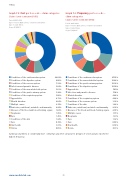
Graph 7.5: Cost per loss code – claim categoriesGraph 7.6: Frequency per loss code –
Claims 5,000–3,000,000 (USD)claim categories
Period: 2005-2014Claims 5,000–3,000,000 (USD)
Types of vessel: Bulk carriers, containers and tankers
Period: 2005-2014
Type of claim: IllnessTypes of vessel: Bulk carriers, containers and tankers
As per 5/10/2015Type of claim: Illness
As per 5/10/2015
Conditions of the cardiovascular systemConditions of the cardiovascular system42.89% 27.05%
Conditions of the digestive systemConditions of the musculoskeletal system8.06% 10.82%
Conditions of the nervous systemConditions of the genito-urinary system7.38% 10.38%
Infectious and parasitic diseasesConditions of the digestive system5.89% 10.09%
Conditions of the musculoskeletal systemAppendicitis 7.60%5.83%
Conditions of the genito-urinary systemInfectious and parasitic diseases 5.22% 7.02%
Conditions of the respiratory systemMental disorders5.06%4.82%
Appendicitis 4.73%Conditions of the respiratory system 4.68%
Conditions of the nervous system Mental disorders3.36% 2.84%
Conditions of the skinMultiple causes3.22% 2.74%
Endocrine, nutritional, metabolic and immunityEndocrine, nutritional, metabolic and immunity2.36% 2.44%
Diseases of the blood and blood-forming organsDiseases of the blood and blood-forming organs 2.05% 1.68%
Multiple causesNeoplasms 1.45% 1.75%
Neoplasms 1.61% Eyes 1.45%
Eyes 1.32% Conditions of the skin 1.44%
Ears 0.88% Ears 0.72%
Oral health 0.58% Oral health 0.13%
Hernia 0.15%Hernia 0.05%
Cardiovascular illness is considerably more costly than any other category for all types of vessel and also reports the
highest frequency.
www.swedishclub.com 46