Page 47 - Layout 1
P. 47
7 Illness
7.2 Statistics
Bulk carriers, container vessels and tankers
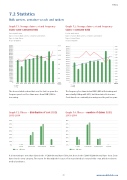
Graph 7.1: Average claim cost and frequencyGraph 7.2: Average claim cost and frequency
Claims 5,000–3,000,000 (USD)Claims 1–3,000,000 (USD)
Period: 2005-2014Period: 2005-2014
Types of vessel: Bulk carriers, containers and tankers Types of vessel: Bulk carriers, containers and tankers
Type of claim: IllnessType of claim: Illness
As per 5/10/2015As per 5/10/2015
56,000 0.16
54,000 38,0000.26
52,000 50,000 36,0000.24
48,000 0.14 34,000
46,000 32,000 0.22
44,000 42,000 30,0000.20
40,000 0.12 28,000
38,000 26,000 0.18
36,000 34,000 0.10 24,0000.16
32,000 22,000
30,000 20,0000.14
28,000 26,000 0.818,0000.12
24,000 16,000
22,000 0.6 14,0000.10
20,000 18,000 12,000
16,000 10,0000.08
14,000 12,000 0.4 0.068,000
10,0006,000
8,000 0.2 0.044,000
6,000 4,000 0.02
2,0002,000
00.002005 2006 2007 2008 2009 2010 2011 2012 2013 20140 2005 2006 2007 2008 2009 2010 2011 2012 2013 2014 0.00PERIOD
PERIODCost Cost
FreqFreq
The above statistics show that over the last ten years the The frequency for claims below USD 5,000 is luctuating and
frequency and cost for claims more than USD 5,000 is was actually falling until 2013, but then started to increase.
increasing.Costs have been constantly increasing over the past ten years.
Graph 7.3: Illness – distribution of cost (USD) Graph 7.4: Illness – number of claims (USD)
2013-20142013-2014
70% 70%
60% 60%
50% 50%
40% 40%
30% 30%
20% 20%
10%10%
0%0%
1-5,0005,000-50,00050,000-500,000500,000+1-5,000 5,000-50,00050,000-500,000500,000+
201320142013 2014
It is interesting to note that claims in the 1-5,000 interval have fallen, but those in the 5,000-50,000 interval have risen. Costs
have risen in every category. The reason for this might be because of increased medical cost and older crew, which need more
medical assistance.
45 www.swedishclub.com