Page 31 - Layout 1
P. 31
5 Cargo
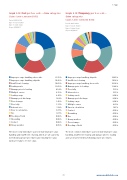
Graph 5.18: Cost per loss code – claim categoriesGraph 5.19: Frequency per loss code –
claim categoriesClaims 5,000–3,000,000 (USD)
Claims 5,000–3,000,000 (USD)Period: 2005-2014
Type of vessel: Tanker
Period: 2005-2014
Type of vessel: Tanker Type of claim: Cargo
As per 30/9/2015
Type of claim: Cargo
As per 30/9/2015
Improper cargo handling, shore-side 21.15% Improper cargo handling, shipside 19.85%
Improper cargo handling, shipside 19.85% Insuficient cleaning19.12%
Insuficient cleaning19.65% Improper cargo handling, shore-side 18.38%
Leaking vents13.65%Damage prior to loading13.24%
Damage prior to loading Poor tally7.35% 8.54%
Multiple causesInherent vice5.15% 8.15%
Leaking cargoLeaking vents2.94% 2.91%
Damage post discharge Damage post discharge 2.94% 1.64%
Poor stowageLeaking cargo2.94% 1.45%
Poor tallyMultiple causes 2.21% 1.37%
Inherent viceError in calculation 1.47% 1.12%
Error in calculationContact 0.74% 0.17%
Fire 0.11% Grounding0.74%
Flooding of hold 0.06% Fire0.74%
Grounding 0.06% Heavy weather 0.74%
Contact 0.06% Poor stowage 0.74%
Heavy weather 0.05%Flooding of hold0.74%
The most costly immediate causes include improper cargo The most common immediate causes include improper cargo
handling and insuficient cleaning, which are all caused by handling, insuficient cleaning and damage prior to loading
not following proper procedures and ensuring the cargo and can be prevented by following proper procedures.
tanks are ready to receive cargo.
29www.swedishclub.com