Page 30 - Layout 1
P. 30
5 Cargo
5.4 Tankers
5.4.1 Statistics
There has been a signiicant increase in the frequency of
1. Leaking vents
cargo claims since 2009, which needs to be monitored as a 2. Improper cargo handling, shore-side
high frequency can negatively affect the overall claims cost.
3. Multiple reasons
The top 10 most expensive cargo claims over the past 10
4. Insuficient cleaning
years were in the following claim categories:5. Damage prior to loading
6. Improper cargo handling, shore-side
7. Improper cargo handling, shipside
8. Improper cargo handling, shipside
9. Leaking vents
10. Improper cargo handling, shipside
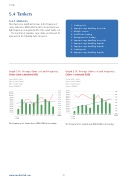
Graph 5.16: Average claim cost and frequency Graph 5.17: Average claim cost and frequency
Claims 5,000–3,000,000 (USD)Claims 1–3,000,000 (USD)
Period: 2005 - 2014 Period: 2005 - 2014
Type of vessel: Tanker Type of vessel: Tanker
Type of claim: Cargo Type of claim: Cargo
As per 30/9/2015As per 30/9/2015
0.22 65,000
120,000 0.4060,000
110,000 0.20 55,000 0.35
100,0000.18 50,000
90,000 0.16 45,0000.30
80,000 0.140.25 40,000
70,000 0.12 35,000
60,000 0.10 30,0000.20
50,000 25,000
40,000 0.08 0.1520,000
30,000 0.06 15,000 0.10
20,000 0.04 10,000
10,0000.02 5,0000.05
0 0.00 0 0.00
2005 2006 2007 2008 2009 2010 2011 2012 2013 2014PERIOD2005 2006 2007 2008 2009 2010 2011 2012 2013 2014 PERIOD
Cost Cost
FreqFreq
The frequency for claims above USD 5,000 is increasing.
The frequency for claims below USD 5,000 is decreasing.
www.swedishclub.com28