Page 24 - Layout 1
P. 24
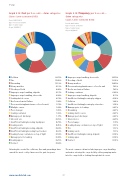
5 Cargo


Graph 5.14: Cost per loss code – claim categoriesGraph 5.15: Frequency per loss code –

Claims 5,000–3,000,000 (USD)claim categories

Period: 2005-2014Claims 5,000–3,000,000 (USD)
Type of vessel: Container
Period: 2005-2014
Type of claim: CargoType of vessel: Container
As per 30/9/2015Type of claim: Cargo

As per 30/9/2015


Collision 24.11% Improper cargo handling, shore-side 14.50%
Fire 15.80% Flooding of hold13.36%

Grounding 15.53%Heavy weather12.60%

Poor monitoring/maintenance of reefer unit Heavy weather9.53% 7.25%
Reefer mechanical failureFlooding of hold8.44% 7.25%

Leaking containerImproper cargo handling, shipside6.57% 6.49%

Improper cargo handling, shipsideImproper cargo handling, shore-side 2.98% 6.11%
Insuficient lashing/securing by shipperLeaking hatch covers2.79% 4.58%

Collision 3.82% Reefer mechanical failure1.98%

Insuficient lashing/securing by stevedore 3.05% Poor monitoring/maintenance of reefer unit 1.79%
Damage prior to loading 2.67% Multiple causes1.49%

Grounding 2.67%Poor stowage1.45%

Leaking container1.36%Leaking hatch covers 2.67%
Damage post discharge1.17% Damage post discharge 2.67%

Inherent vice0.85% Inherent vice2.29%

Insuficient lashing/securing by shipper 0.78% Poor stowage1.91%
Leaking vents0.76% 1.53%Loading heavy containers on top of light

Insuficient lashing/securing, shipside 0.68% Fire 1.53%

Insuficient lashing/securing by stevedore 0.61% Leaking vents1.15%
Loading heavy containers on top of light 0.58% Insuficient lashing/securing, shipside0.76%

Damage prior to loading0.48% Leaking pipes0.76%

Leaking pipes0.25% Contact 0.38%
Contact0.02%


The most common claims include improper cargo handling Catastrophic events like collisions, ires and groundings have
and water entering the cargo hold by either pumping water caused the most costly claims over the past ten years.

into the cargo hold or leaking through hatch covers.


www.swedishclub.com22