Page 23 - Layout 1
P. 23
5 Cargo
5.3 Container vessels
5.3.1 Statistics
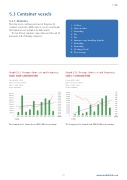
There has been a continuous increase in frequency for
1. Collision
container vessels since 2009, and is a concern even though 2. Heavy weather
the frequency is not as high as for bulk carriers.
3. Grounding
The top 10 most expensive cargo claims over the past 10
4. Fire
years were in the following categories:5. Fire
6. Improper cargo handling, shipside
7. Grounding
8. Grounding
9. Flooding of hold
10. Poor stowage
Graph 5.12: Average claim cost and frequency Graph 5.13: Average claim cost and frequency
Claims 5,000–3,000,000 (USD)Claims 1–3,000,000 (USD)
Period: 2005 - 2014 Period: 2005 - 2014
Type of vessel: Container Type of vessel: Container
Type of claim: CargoType of claim: Cargo
As per 30/9/2015As per 30/9/2015
0.30 110,000 0.60
200,000 0.28 0.55
180,000 100,000 0.26 0.50
160,000 0.24 90,000 0.22 0.45
80,0000.40 0.20
140,000 0.18 0.3570,000
120,000 0.16 60,000
100,0000.300.14 50,000
80,000 0.12 40,000 0.25
60,000 0.10 0.20
40,000 0.08 30,000 0.150.06
20,000 0.100.04
20,00010,000 0.05 0.02
0 2005 2007 2008 2010 2013 0.00 0 0.00
2006 2009 2011 2012 2014PERIOD2005 2006 2007 2008 2009 2010 2011 2012 2013 2014 PERIOD
Cost FreqCost
Freq
The frequency for claims above USD 5,000 is increasing.The frequency for claims below USD 5,000 is decreasing.
21www.swedishclub.com